U.S. Covid-19 Vaccination Rate by Age
March 21, 2021 · Data refreshed May 4, 2021
Covid-19 vaccine distribution is underway across the globe and in the United States. Since age is a significant factor in Covid-19 mortality and hospitilization [1], vaccination rate should be analyzed with respect to age. The Center for Disease Control (CDC) reports age data for >90% of administrations and shows the breakdown of ages among vaccine recipients in the plot shown below [2].
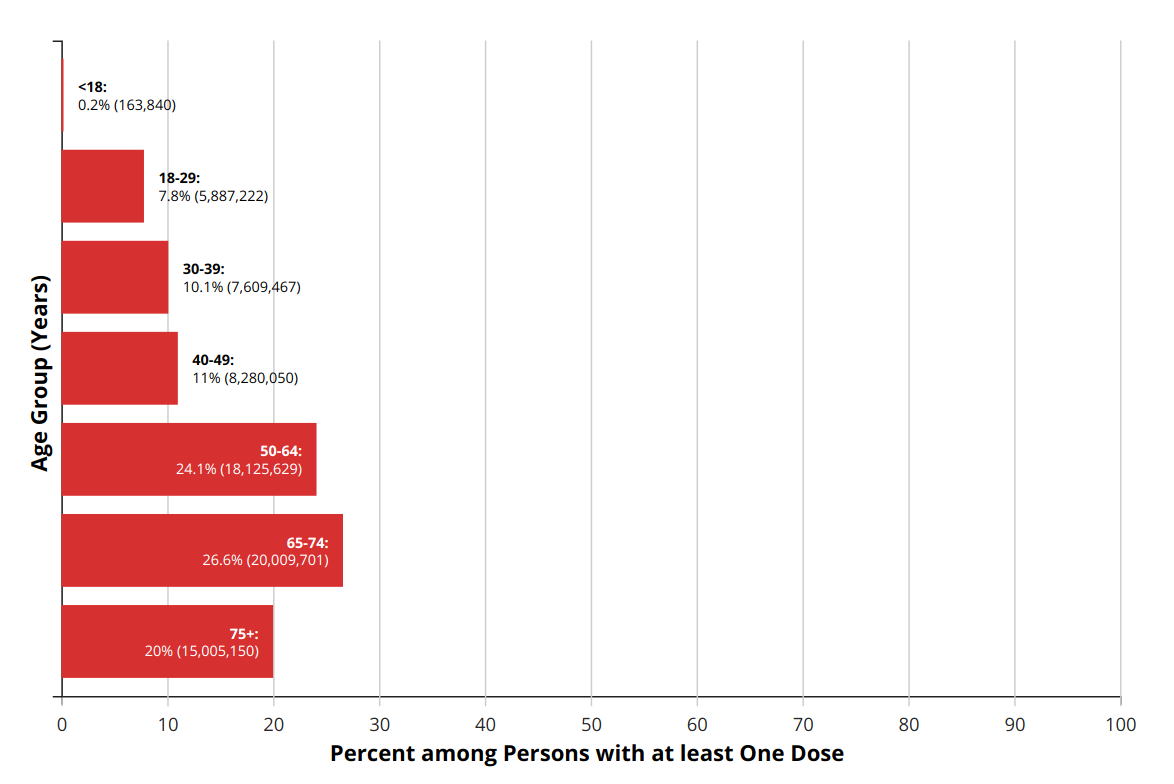
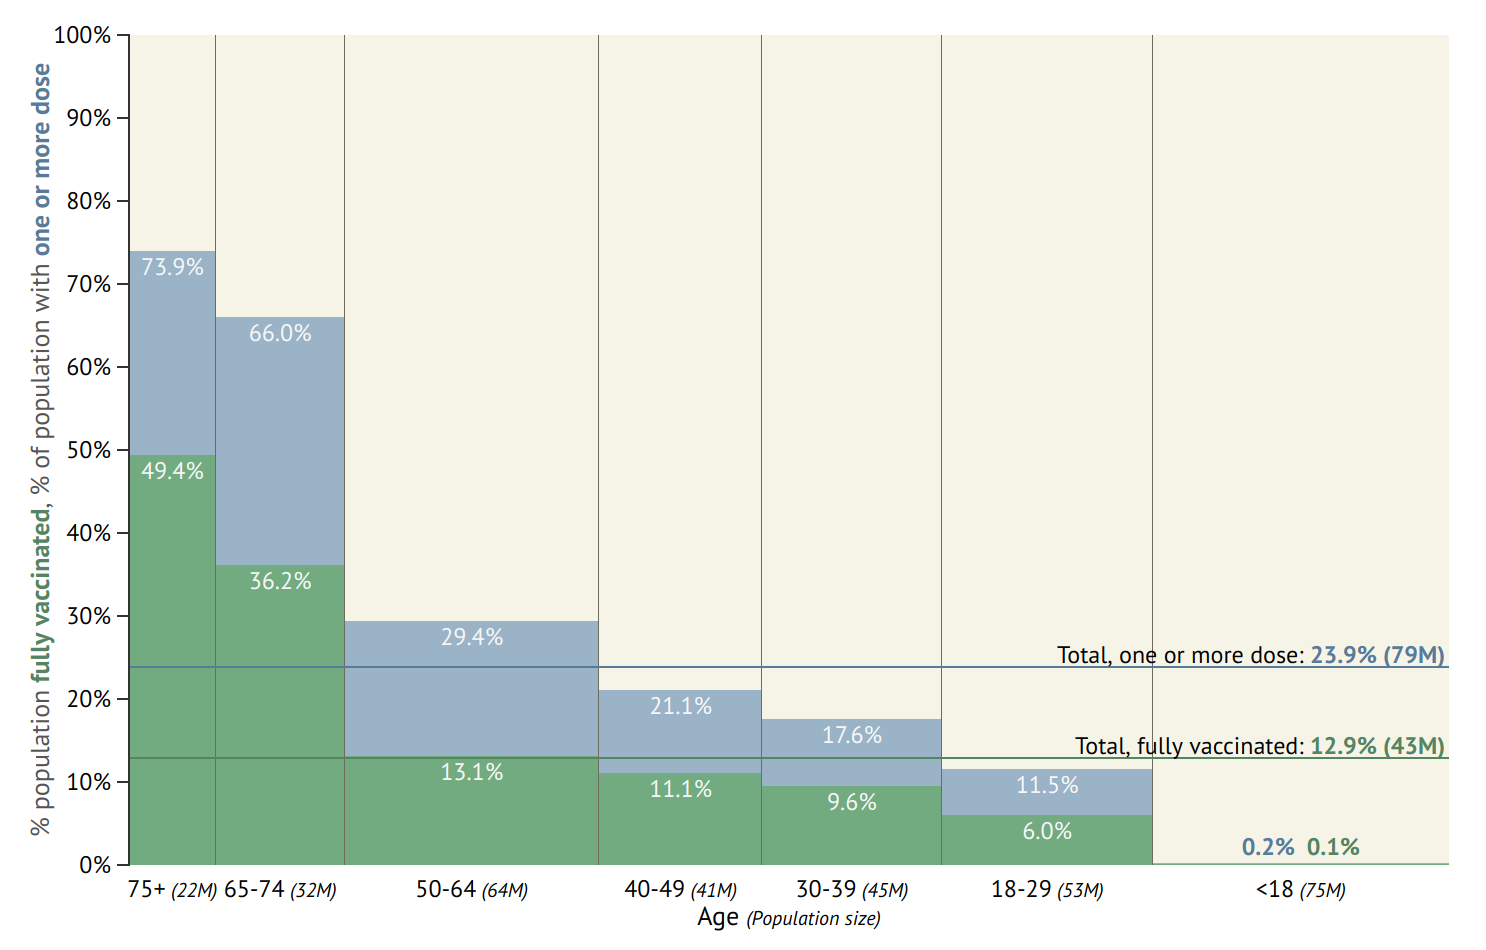
In the chart above, however, it is not clear what percentage of the population in a given age group has received the vaccine. To answer this, we can simply divide the number of people vaccinated by the total population in each age group. The plot below shows the rate of people who are fully vaccinated and who have received at least one dose of the vaccine and the width of the bars are proportional to the number of people in the age group.
Data updated Tuesday, May 4 2021 at 10:20 PDT.
Vaccination demographic data from the CDC: covid.cdc.gov/covid-data-tracker/#vaccination-demographic
**Note: Age data is missing for ~8% of administrations. Age distribution between administrations where age data is available and not available is presumed to be the same.
Age and population data from "U.S. Census Bureau, Population Division, 2020 Demographic Analysis": census.gov/data/tables/2020/demo/popest/2020-demographic-analysis-tables.html
[1] cdc.gov/coronavirus/2019-ncov/covid-data/investigations-discovery/hospitalization-death-by-age.html
[2] covid.cdc.gov/covid-data-tracker/#vaccination-demographic