ByteMuse.com

The code and musings of @ChrisPolis

About Posts Contact

Open-high-low-close(OHLC) Charts with D3.js

July 7th, 2014

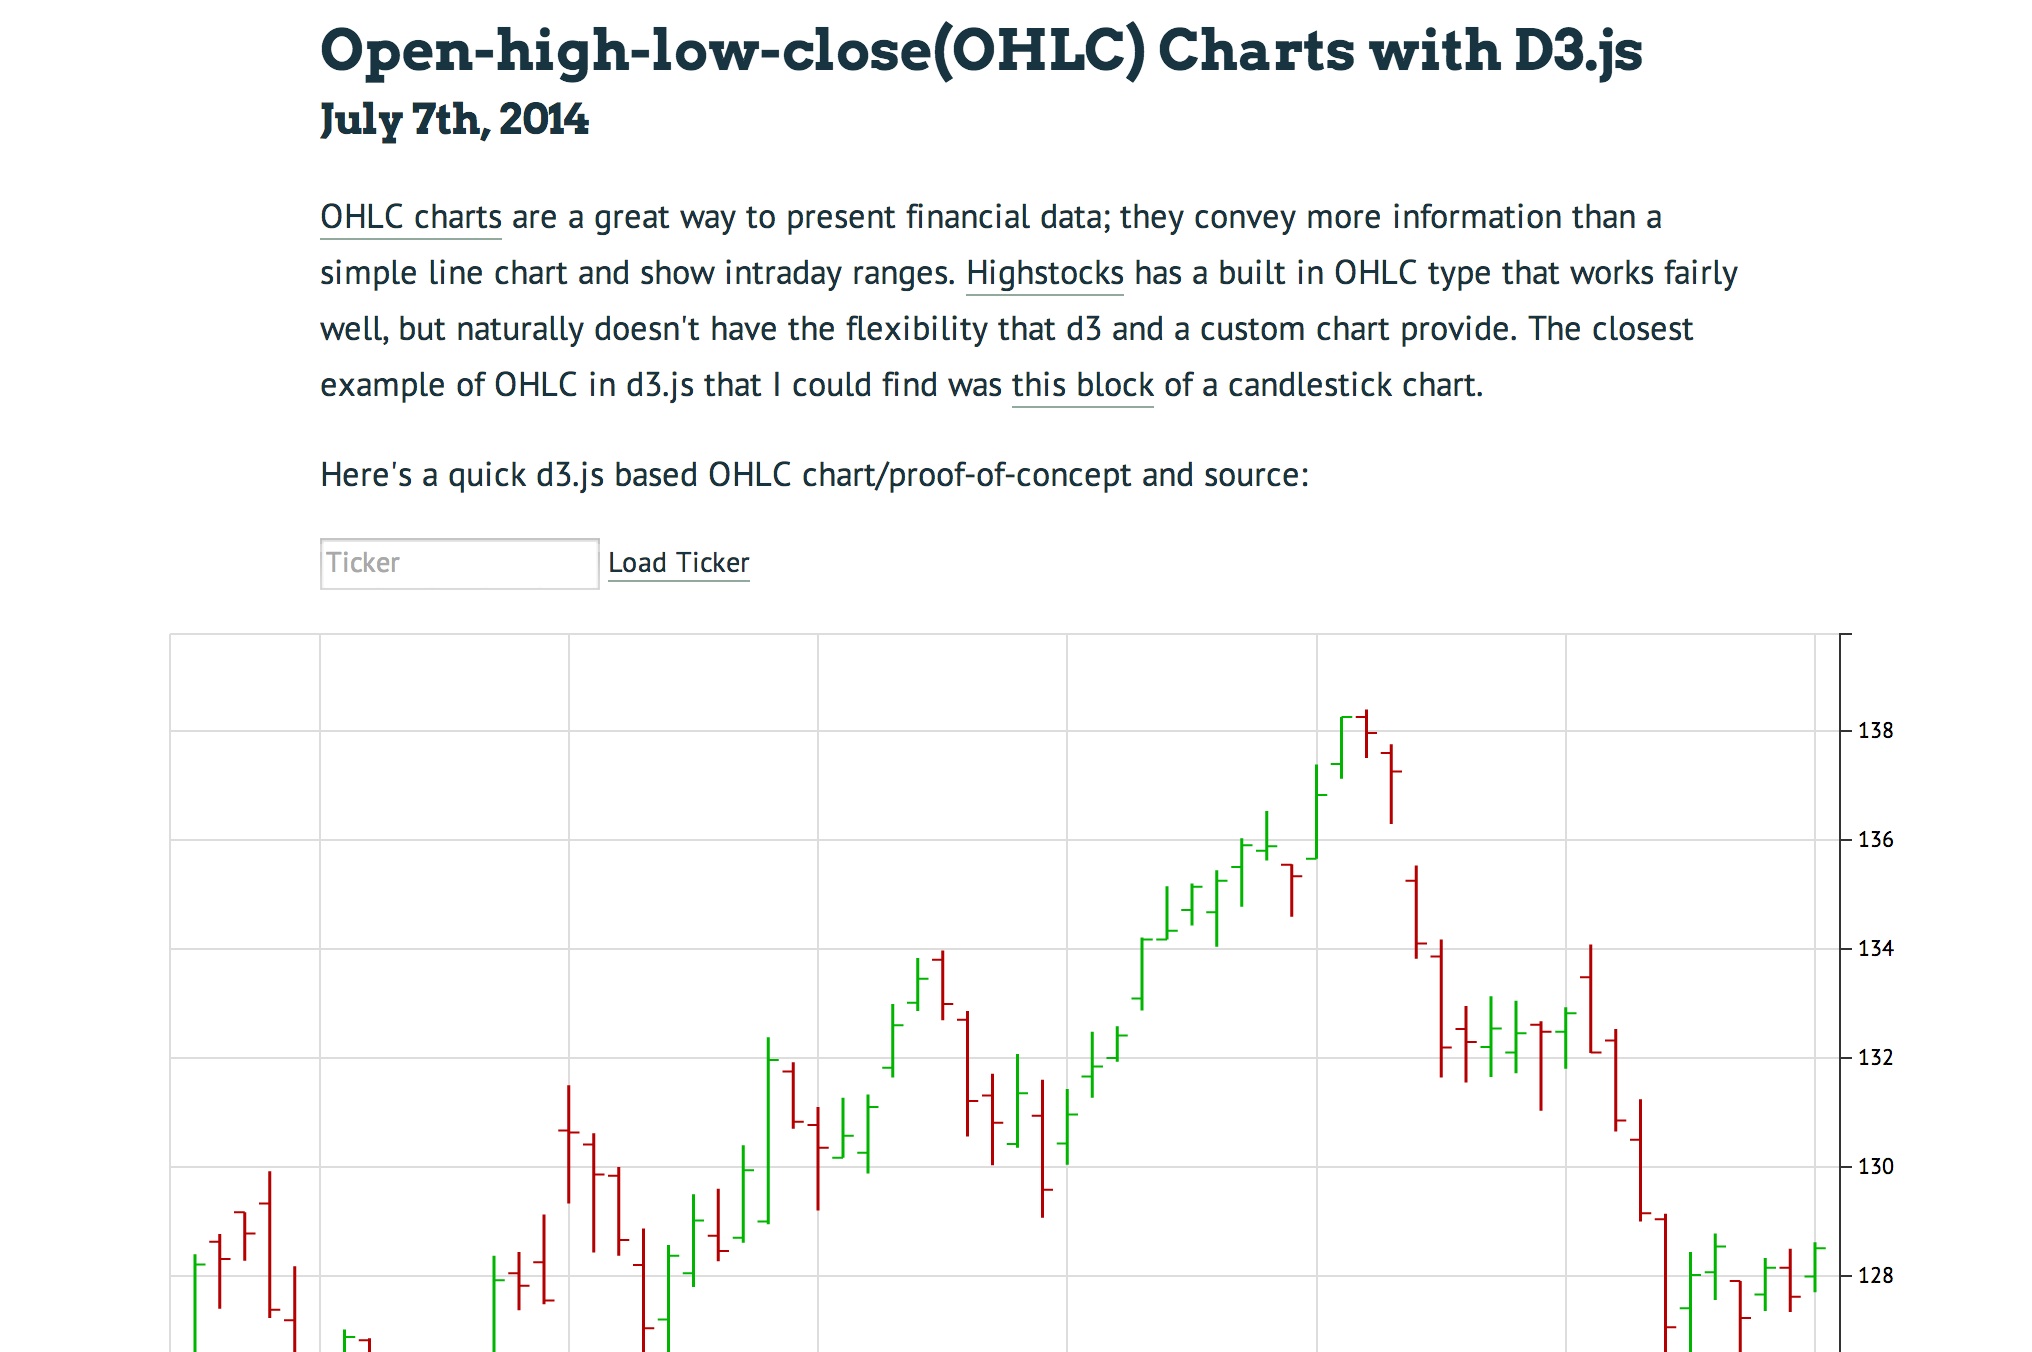
OHLC charts are a great way to present financial data; they convey more information than a simple line chart and show intraday ranges. Highstocks has a built in OHLC type that works fairly well, but naturally doesn't have the flexibility that d3 and a custom chart provide. The closest example of OHLC in d3.js that I could find was this block of a candlestick chart.

Here's a quick d3.js based OHLC chart/proof-of-concept and source:

Load Ticker

View Source Hide Source

#
chartEl = d3.select '#ohlc'
elWidth = parseInt chartEl.style('width')
margin  = { top: 5, right: 45, left: 10, bottom: 30, bar: Math.floor(elWidth/500) }
width   = elWidth - margin.right - margin.left
height  = if width > 720 then 520 else width * .7
dFormat = d3.time.format "%b %d"
parseFormat = d3.time.format "%Y-%m-%d"

#
chartEl.style 'height', "#{height + margin.top + margin.bottom}px"
svg     = chartEl.append('svg').append 'g'
            .attr 'transform', "translate("#{margin.left},#{margin.top})"

# URI/Query adapted from http://bl.ocks.org/abeppu/1074045
yFinanceURI = "http://query.yahooapis.com/v1/public/yql?q=select%20*%20from%20yahoo.finance.historicaldata%20where%20symbol%20%3D%20%22BA%22%20and%20startDate%20%3D%20%222014-04-01%22%20and%20endDate%20%3D%20%222014-07-04%22&format=json&env=store%3A%2F%2Fdatatables.org%2Falltableswithkeys"

#
d3.json yFinanceURI, (error, apiData) ->
  return unless apiData?.query?.results?.quote.length

  #
  data = apiData.query.results.quote.map (d) ->
    date: parseFormat.parse d.Date
    o:    parseFloat d.Open
    h:    parseFloat d.High
    l:    parseFloat d.Low
    c:    parseFloat d.Close
  barWidth = width / data.length

  #
  x = d3.scale.linear()
        .range [0, width]
        .domain [data.length, -1]
  y = d3.scale.linear()
        .range [height, 0]
        .domain [
          (d3.min data, (d) -> d.l) * 0.99,
          (d3.max data, (d) -> d.h) * 1.01 ]

  #
  xAxis = () ->
    d3.svg.axis()
      .scale x
      .orient 'bottom'
      .ticks 6
  yAxis = () ->
    d3.svg.axis()
      .scale y
      .orient 'right'
  #
  svg.append 'g'
     .attr 'class', 'grid'
     .call xAxis().tickSize(height, 0, 0).tickFormat("")
  svg.append 'g'
     .attr 'class', 'x axis'
     .attr 'transform', "translate(0, #{height})"
     .call xAxis().tickFormat (d) -> dFormat(data[d].date) if data[d]?
  svg.append 'g'
     .attr 'class', 'grid'
     .call yAxis().tickSize(width, 0, 0).tickFormat("")
  svg.append 'g'
     .attr 'class', 'y axis'
     .attr 'transform', "translate(#{width}, 0)"
     .call yAxis()

  #
  bars = svg.selectAll '.bar'
            .data(data).enter()
            .append 'g'
              .attr 'class', (d) ->
                "bar #{if d.c > d.o then 'green' else 'red'}"

  # High-low line
  bars.append 'path'
      .attr 'class', 'hl-line'
      .attr 'd', (d, ndx) ->
        "M#{x(ndx)},#{y(d.h)} L#{x(ndx)},#{y(d.l)}"

  # Close tick
  bars.append 'path'
      .attr 'class', 'c-tick'
      .attr 'd', (d, ndx) ->
        "M#{x(ndx)},#{y(d.c)} L#{x(ndx)-margin.bar+barWidth/2},#{y(d.c)}"

  # Open tick
  bars.append 'path'
      .attr 'class', 'o-tick'
      .attr 'd', (d, ndx) ->
        "M#{x(ndx)+margin.bar-barWidth/2},#{y(d.o)} L#{x(ndx)},#{y(d.o)}"


Tweet
Ohlc preview

© Chris Polis, 2012 - 2016

GitHub · Twitter · LinkedIn · Stack Overflow · Quora